top of page

Excel Portfolio
Welcome to my portfolio, revealing the limitless potential of Excel. Explore a collection of dynamic dashboards and reports designed to transform data into strategic decisions. Each visualization demonstrates the power of tailored tools built to address specific business needs.
My services include designing interactive dashboards, automating complex data processing, conducting data analysis, and enhancing data quality. See how my expertise can help you enhance your management and achieve your productivity and performance goals.
All reports, dashboards and visualizations are based on real-world use cases. To ensure confidentiality, data and context have been anonymized.
Reports
Reports
HR Workforce Monitoring Report (Company-Branded)
-
Detailed monthly trends in workforce distribution by job, region, hires and terminations
-
Interactive data exploration for an in-depth understanding of workforce dynamics
-
A versatile tool, adaptable to businesses of all sizes, for optimized and high-performance workforce management
Flying Club Activity Report
● Centralized tracking of flight operations, financial data, and activity by member and aircraft
● Detailed analysis of account balances and activity, with quick access to member and aircraft details for streamlined daily operations
● Customizable for flying clubs and any organizations with structured activities
Dashboards
Dashboards

Automated Performance Monitoring Dashboard
-
Detailed tracking of activity progress with categorized performance indicators
-
Instant service status analysis, making it easier to track deadlines and invoicing
-
A flexible project or activity tracking tool tailored to your specific needs
Automated Activity & Financial Tracking
● Dynamic consolidation of key activity indicators for a selected period
● Interactive visualization of overall performance with real-time trend tracking
● Customizable tracking tool to enhance organizational efficiency


Project Performance Tracking
-
Real-time tracking of key project performance indicators
-
Efficiency, compliance and strategic goals analysis
-
A management tool designed to optimize overall performance and improve forecasting
Geographic visualizations
Geographic Visualizations
Workforce Distribution by Location
-
Geographic distribution of company sites
-
Interactive visualization with color coding and size scaling based on workforce numbers
-
Spatial and comparative analysis for a clear view of territorial presence
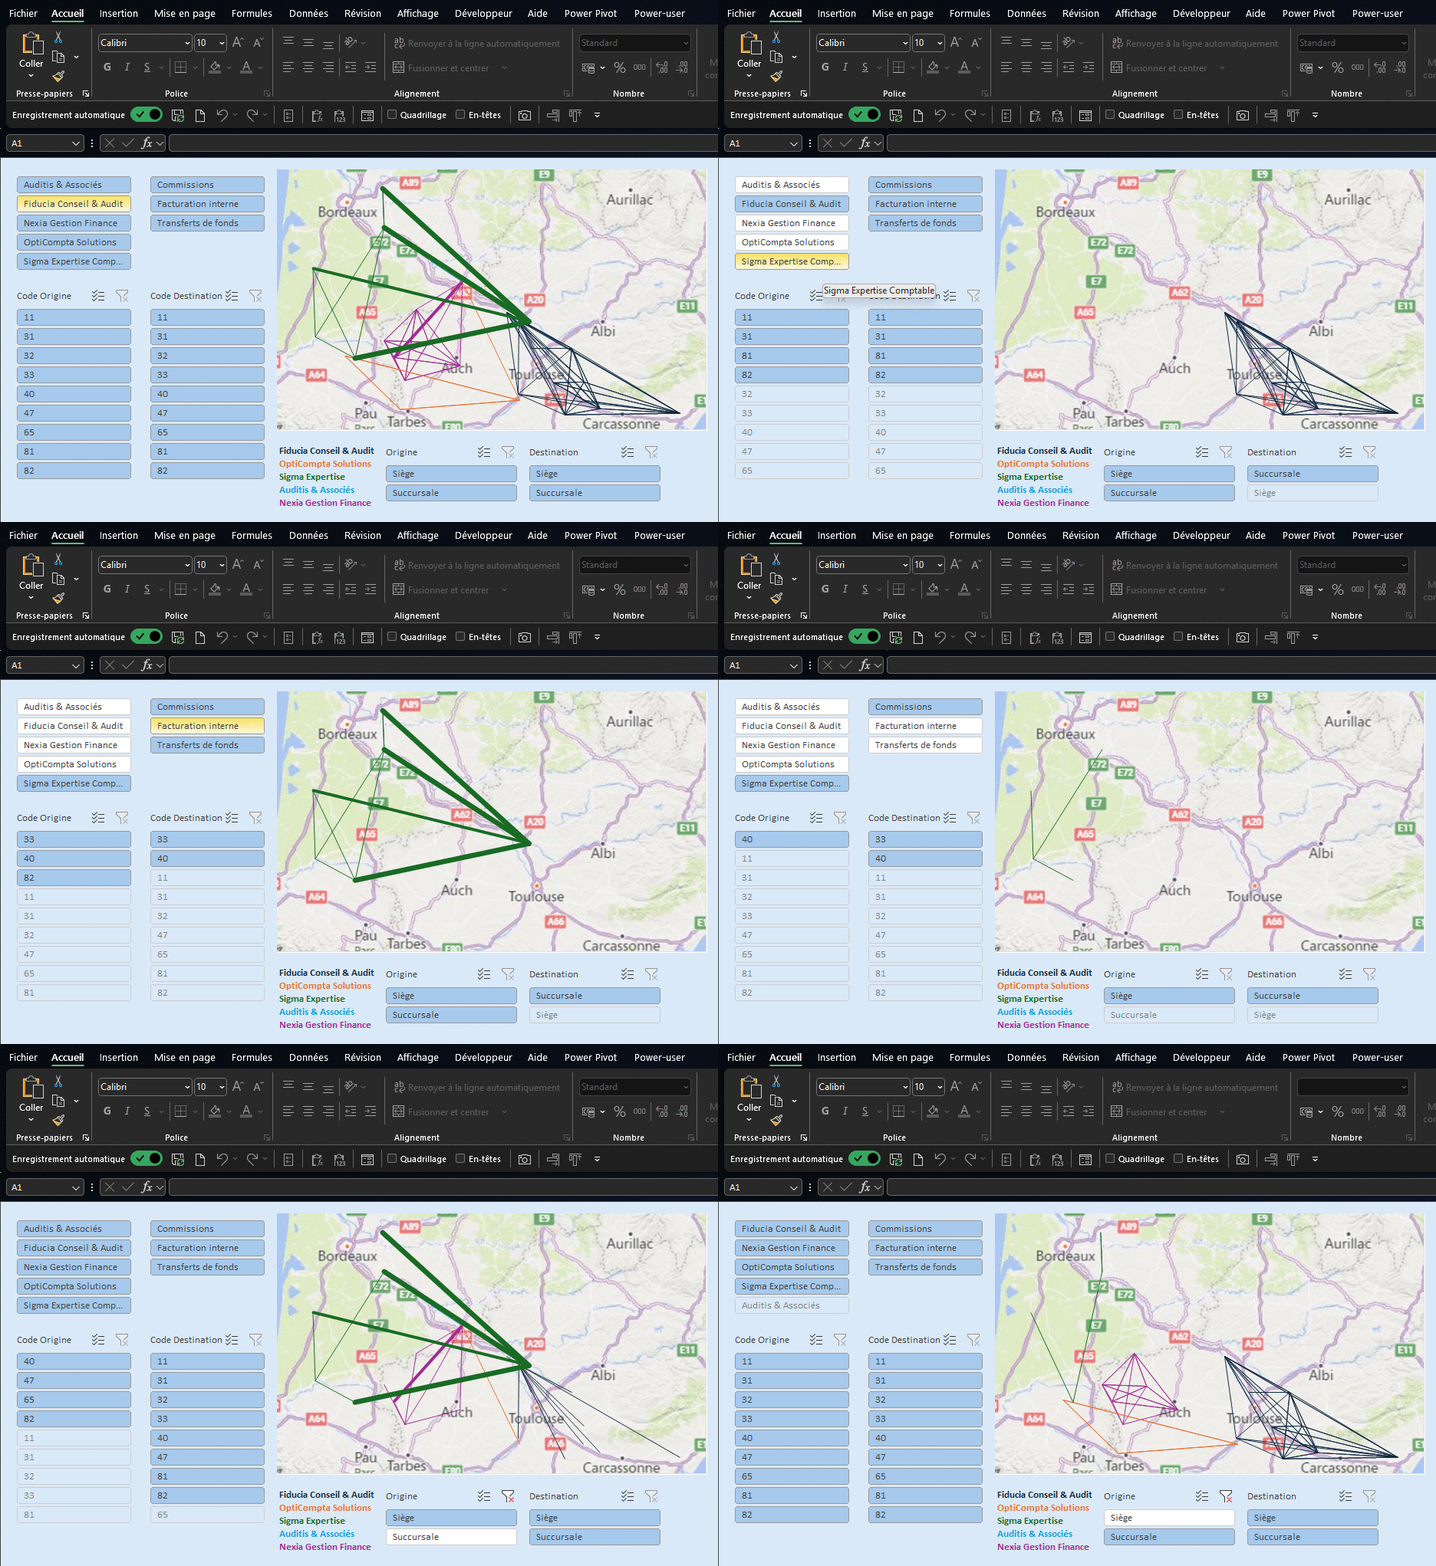
Financial Transactions Between Sites
● Geographic mapping of inter-site financial flows
● Flow visualization with line thickness proportional to transaction volume
● Visualization of exchanges with line width proportional to transaction volume

Can we do this in Excel
"Can we do this in Excel?"

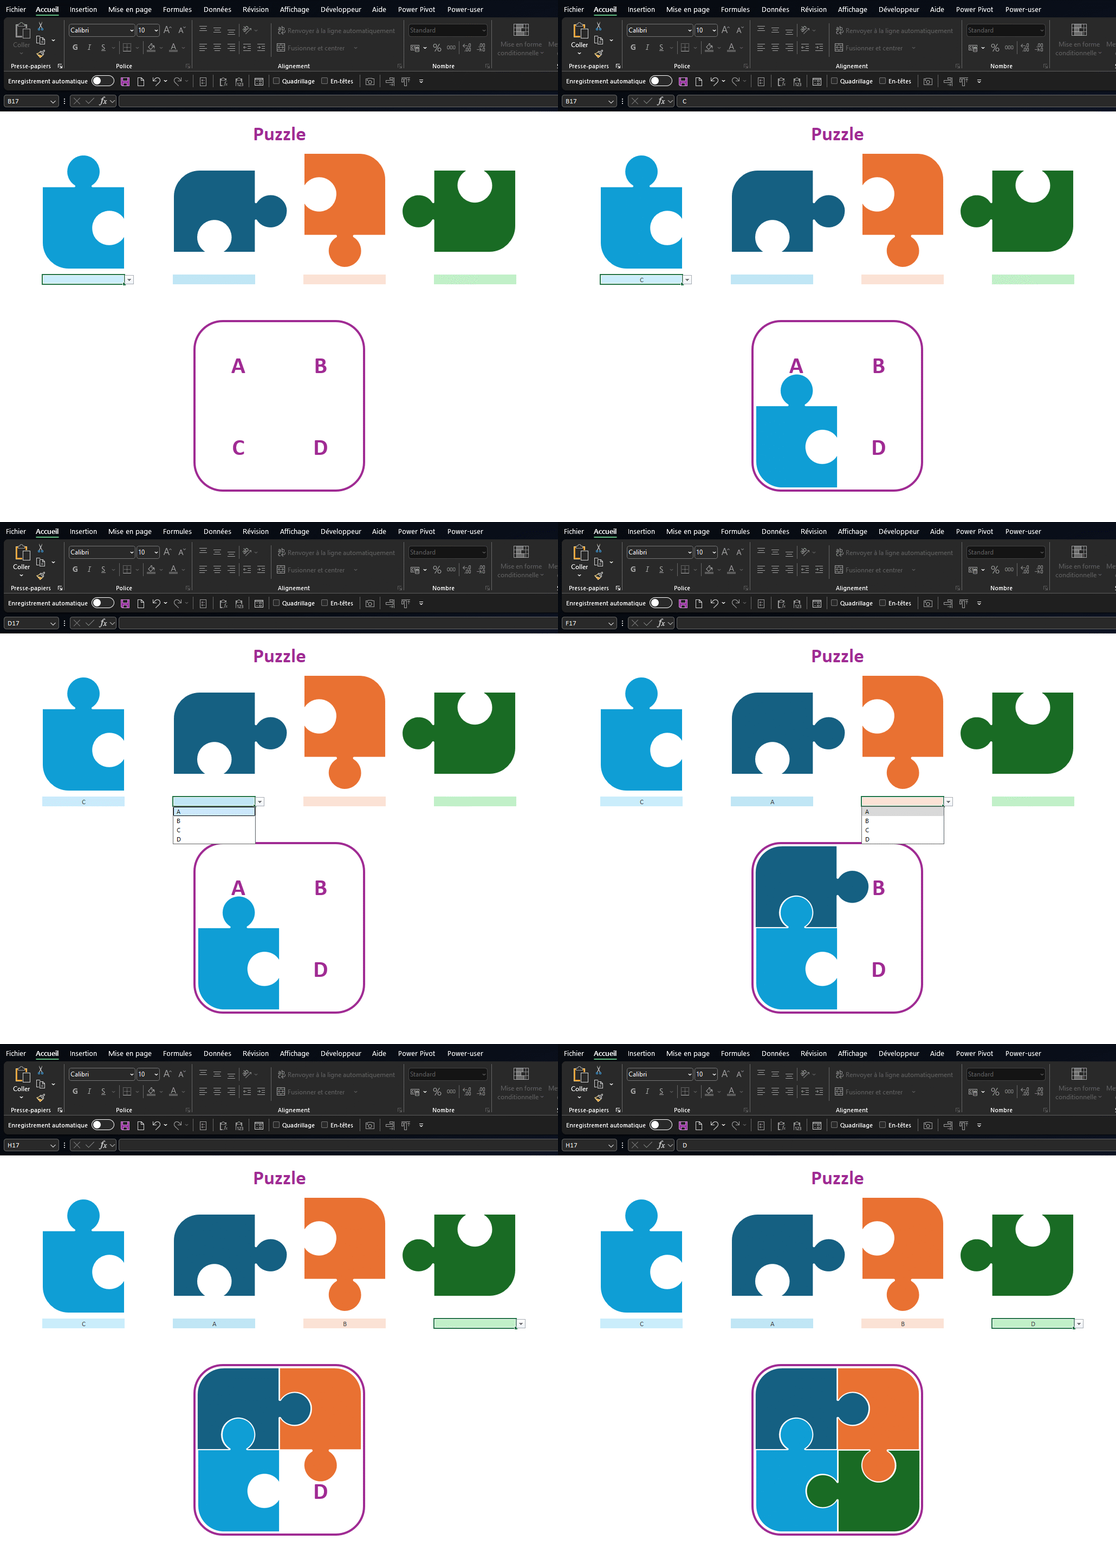
Interactive Puzzle
-
Reconstruct a puzzle by positioning pieces
-
Match pieces based on markers
-
Showcasing Excel's logic and interactive capabilities
Santa's tour
● Animated visualization of Santa's journey accross Europe from Lapland
● Colorful route display with dynamic elements
● Illustrating movement and animation in Excel
Quiz Game
-
Interactive quiz where a climber progresses toward the summit as correct answers are given
-
Score and climber's progress displayed at the end of the quiz
-
Showcasing Excel's potential for gamification and advanced interactivity
Progress Tracking
● Animated indicators illustrating data progression
● Real-time visualization of progress
● Dynamic representations for clear and intuitive data insights
bottom of page
